Co-WIN: Really Winning? Analysing Inequity in India’s Vaccination Response
Overall, India has achieved remarkable results in its vaccination drive, given the inherent weakness of our healthcare system. However, with only roughly 50% of the Indian population fully vaccinated as of 20th January 2022, India still has a long way to go. Throughout the course of the vaccination drive so far, multiple new policies have been introduced to ensure that vaccines are readily available and vaccination coverage is increased. However, at the same time, some of the government policies introduced have led to unintended inequities in the populations being targeted.
We enumerate and analyze the inequities that existed in India’s vaccination policy drive, and also compute the effect of the new policies that were introduced. We analyze these potential inequities not only qualitatively but also quantitatively by leveraging the data that was made available through the government portals. Specifically, (a) we discover inequities that might exist in the policies, (b) we quantify the effect of new policies introduced to increase vaccination coverage, and (c) we also point the data discrepancies that exist across different data sources.
For our analysis, we use data from the CoWIN Dashboard.
Distribution of Administered Vaccines and Centers
We consider the number of vaccines administered and number of centers present in each district to be an indicator of the vaccine accessibility and coverage. We study these variables in relation to the rural-ness and urban-ness of the district, the literacy rate, gender ratio and the ratio of Scheduled Caste and Scheduled Tribe population.
Correlation analysis
For preliminary analysis, we rely on Pearson correlation (Figure 1) to identify how states are performing in terms of (a) making available vaccination centers and (b) total vaccination percentage. We correlate the performance of each state on these target variables along sensitive societal variables – (i) rural ratio and (ii) literacy rate. A state performing well, i.e., being equitable along these sensitive variables will have no or low correlation between performance and sensitive variables.
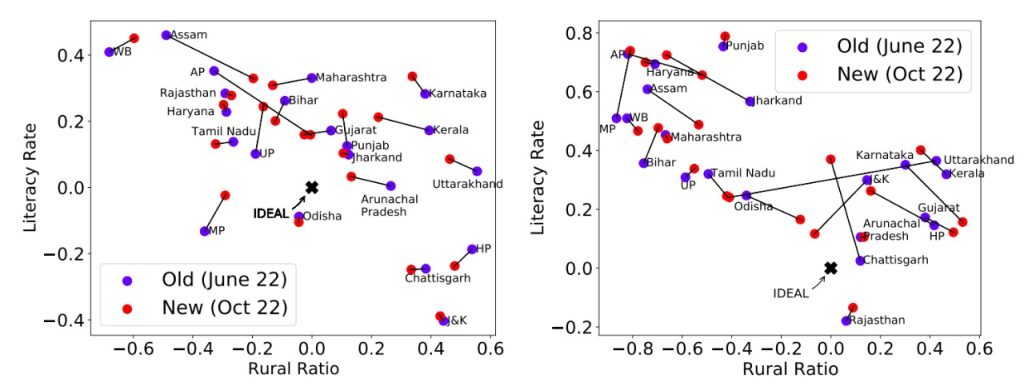
We can observe that most states have negative correlation with rural ratio, i.e., as rural ratio increases, the number of vaccination centers or the total vaccination percentage decrease. Similarly, we see most states have positive correlation with literacy rate i.e. as literacy rates increase, the number of vaccination centers or the total vaccination percentage increases. Even when noticing temporal trends i.e. between two dates three months apart, we note that most states try to improve on the performance metrics and try to move closer to the equitable line.
Spatial Regression
We rely on spatial regression models (Table 1) to model the relationship between districts and their relative performance on the number of vaccination centers made available and the total percentage of vaccinated individuals. Spatial regression models allow to identify the trend while controlling for spatial lag effects.
We use target variables as the number of vaccination centers per district, and log of total number of vaccines. To understand the effect between different sensitive variables and the performance variables, we include multiple sensitive attributes (after normalizing for population) as mentioned above. To control for the population variance that might exist in the data, we include control for the logarithm of population. Similarly, to account for the vastness of the district, we include the logarithm of area as well.
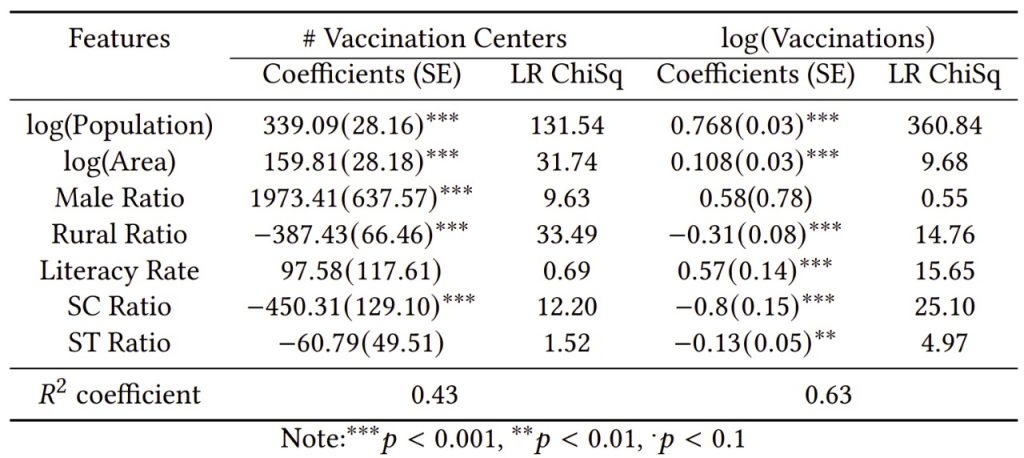
We observe that in the case of vaccination centers as the target variable, every feature except literacy rate and Scheduled Tribe (ST) population ratio is significant. Rural ratio and Scheduled Caste (SC) ratio have a significant negative coefficient, i.e., districts with higher rural ratio and SC population tend to have lower number of centers meaning that there is some inequity based on these two features.
For vaccines as target variable, the ratios of Rural, SC and ST populations all have a significant negative effect. In this case, literacy rate has a notable positive effect on the number of vaccines made available. The difference in how literacy rate affects one response variable but not the other is intriguing. We hypothesize that this could be due to the fact that vaccine booking and administration is something that is more affected by the characteristics of the general population, unlike decisions around vaccination center planning, which are made by the government. Area, as expected, has a high significant positive effect on the number of centers.
Inequities in Government Policies
The primary way of getting vaccine appointments i.e. CoWIN app is primarily a web portal for vaccine appointment booking, which requires access to the Internet. Even with 100% increase in number of people with access to Internet in the past 5 years, the number of internet subscribers in India as of March 2021 stands at 825.30𝑀, which accounts for roughly 58% of the population. The demographics of people who do not have access to the Internet are not uniform and centered on the subsections of people who are already societally disadvantaged.
Moreover, since its release to the general public on March 1, 2021 up until June 4, 2021, CoWIN was only available in English. According to the 2011 census data, only 10.67% of Indians speak English as their first, second or third language. For these reasons, the most vulnerable were often those who could not book vaccination appointments due to comprehensibility issues. For example, daily wage workers who were least likely to have the knowledge and means to use a smartphone application did not have any incentives to forgo the day’s wages to get vaccinated, while being the ones who did not have the privilege to work remotely.
The government released the CoWIN API with the intention to be advantageous to the population. However, not all sections of the population could reap these benefits equally. Developers facilitated near-immediate booking of freshly opened slots by building bots that exploit the API. Most of these popular bots are programmed to be on online social platforms such as Telegram or Twitter, which are known to have biased user distributions. Later on, the government took some steps to curb the effect of such bots.
Effectiveness of Government Policies
To quantitatively assess the effectiveness of government policies on the vaccination drive, we leverage Regression Discontinuity in Time (RDiT). For a given policy to be effective, we should see an increase in the vaccination rates post-implementation of policy compared to pre-implementation of policy. For this analysis, we use the percentage of people that were vaccinated daily as the target response variable. Since this number has a high variance, we smooth it out using a moving average with a window of past 7 days.
In particular, we analyse two policies – (1) Government introduced the policy mentioning that 75% of the vaccines will be provided to the states for free from June 21, 2021; and (2) Policy introduced on June 4, 2021 through which CoWIN expanded to support 11 other languages which include Hindi, Marathi, Malayalam, Punjabi, Telugu, Gujarati, Assamese, Bengali, Kannada, and Odia. We believe that both of these policies were centered around making vaccination drive more equitable towards marginalized sections of the society. We focused on the effect of these policies across states and across districts with different rural-ness.
June 21st Policy
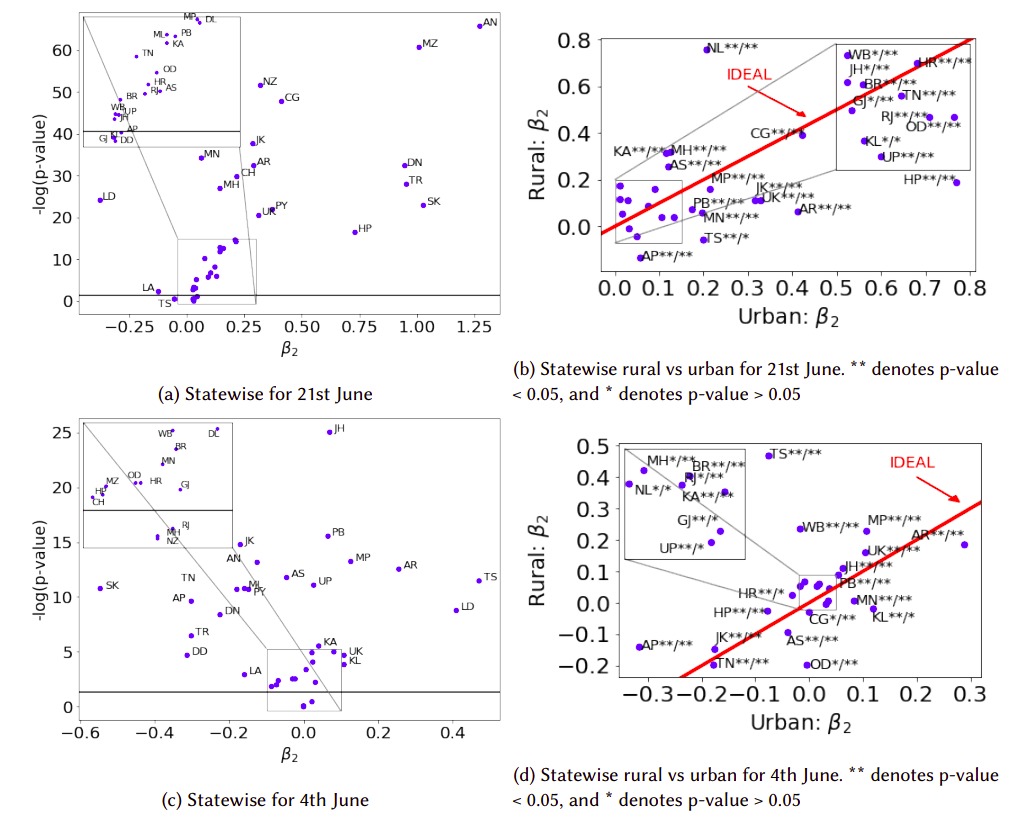
On applying RDiT to understand the effect of policy introduced on June 21st, we note that for most of the states the effect of the policy was positive, i.e., it led to more vaccinations. In Fig 3a, all results above the horizontal grey line are significant. The 𝛽2 value indicates the impact of the policy, meaning higher the value, more positive was the impact of the policy on the number of vaccinations. We can see that states like Andaman & Nicobar Islands and Mizoram benefited the most from this policy, while there was not much improvement in Lakshwadeep and Ladakh.
To understand whether the policy actually assisted in making vaccination drive more equitable, we performed similar analysis on rural and urban districts within each state. We define those districts as rural that have rural ratio in the top 25 percentile, and those as urban, which have rural ratio in bottom 25 percentile. We remove those states which did not have enough number of distinct rural and urban districts from our analysis to avoid including data points with a small sample size. In Figure 3b, most results are significant (above the horizontal grey line). Each state is represented by two dots, blue dot for the rural districts and red dot for the urban districts within that state. In states like Nagaland and Maharashtra, rural districts benefited a lot more. Note that in Arunachal Pradesh, the impact was opposite and urban districts had a more positive impact from this policy, unlike Chattisgarh where the impact was comparable for rural and urban districts.
June 4th Policy
Similar to the June 21st policy, we also analyze June 4th policy using a similar methodology. We report the effect of the policy to enable more regional languages in the CoWIN app for different states in Figure 3c. The results are mixed in this case. While states like Arunachal Pradesh, Telangana, and Lakshwadeep did have more vaccinations, the number of vaccinations actually went down in Sikkim, Tamil Nadu, and many other states.
We also check the effect of policy on rural and urban districts. Taking the same definition for binary label of rural and urban districts as above, we report effect of the policy on rural and urban districts in Figure 3d. We note that in some states, one of the data points (either rural or urban) is not significant (below the horizontal line in the graph), so we cannot make conclusions about these states. On the other hand, in states like Telangana, Andhra Pradesh Pradesh, West Bengal, Madhya Pradesh and Jharkhand, rural districts had a significantly more positive impact from the policy. We hypothesize that this could be because the new languages that were introduced were primarily spoken by people of these states.
Data Quality Issues and Observations
During our study, we found some oddities and inconsistencies that are important to highlight here. The data from the different sources we leveraged for this study were the only data sources made public and likely motivated several decisions and policies that were made at the state and central level in India. For this reason, it is critical that such data is reported accurately to aid effective decision making.
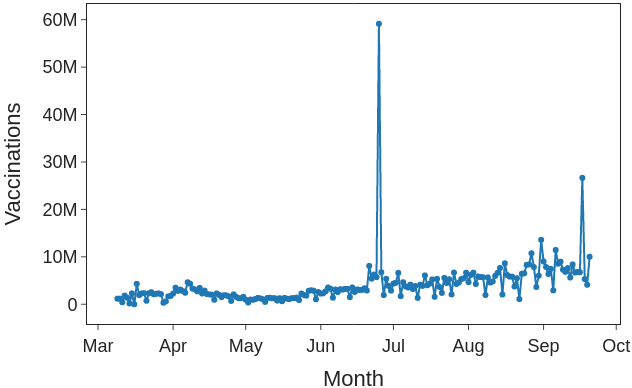
Fig. 4 demonstrates the spike in total number of daily vaccinations that was seen during the week of June 19 to June 25. According to the API, 90.84 million vaccinations were given that week. However, the dashboard’s weekly graph displays 41.20 million. That is a difference of precisely 49,642,682 vaccine doses just for that week. While this is the most drastic discrepancy in numbers, we consistently observe such discrepancies amongst the different data divisions present within the dashboard itself.
Discussion and Conclusion
The COVID-19 pandemic has affected some people much worse than others; vaccinating the population is crucial to combat the effects of the pandemic. It is essential that the distribution of vaccines is done equitably. Throughout the pandemic, technology, data, and policy-making seemed to have played a big role, especially in India. We fully understand complexity in implementing any health care policy in India; we acknowledge the remarkable results India has achieved in its vaccination drive. We found various sources of data being published regarding the number of cases, availability of vaccines, phone applications and bots being developed, distribution of vaccines, and planning and execution of policies at the health centre level. We used data reported about vaccination statistics to analyse the inequities and found that some states were more biased in their distributions. We analysed the effectiveness of two major policies that were introduced, and demonstrated how some of these policies failed at achieving equitable distribution in some states. It is also essential that the vaccination data made available is consistent and accurate to inform reliable policies and decisions. We highlight inconsistencies in the vaccination data made available on the CoWIN Dashboard. Through quantitative analysis, we point out critical inequities in the administration of vaccinations and advocate that future policies be made by taking equity and transparency into account.
For more details please read our full paper.